Structure of the thesis analysed[]
The thesis analysed is based on the following four publications:
- M.J.M et al. (2008a) Neurol Res. 2008 Jun;30(5):476-9 - PMID: 18953738
- M.J.M et al. (2008b) Neurol Res. 2008 Jun;30(5):457-60 - PMID: 18953734
- M.J.M et al. (2012) Exp Toxicol Pathol. 2012 Mar;64(3): 133-9 - PMID: 20688496
- Probst et al. (2012) Mediators Inflamm. 2012; 2012: 136020 - PMCID: PMC3316998
M.J.M has been the first author (or joint first author) of all those publications and in the thesis he states clearly that he has contributed to all papers significantly (for all four papers he contributed to the execution, analysis, interpretation and writing of the study: ("Erarbeitung, Analyse, Interpretation, Formulierung des Manuskripts") and for all papers except M.J.M et al. (2008a) he also contributed to the study design ("Konzeption").
The thesis has 55 pages overall, of which 22 pages are taken up by these four publications that form its core. Evidence for plagiarism has only been found in the paper M.J.M et al. (2012), where, however, all results, all figures and most of the text including the literature review and the discussion section have been taken from a source that is not mentioned anywhere.
The source[]
The paper M.J.M et al. (2012) is based almost entirely on the dissertation Mallig (2006), which is not mentioned anywhere in it. Mallig (2006) is written in German while M.J.M et al. (2012) is written in English, such that parallel text has been translated.
While it is reasonable to assume that more people have contributed to the study described in Mallig (2006), the author of Mallig (2006) must have contributed to it to a very significant degree, otherwise she could not have submitted it as her doctoral thesis. Note also: While the second lead author of M.J.M et al. (2012) is mentioned in the acknowledgements of Mallig (2006) in general terms (page 195: "Der restlichen Polytrauma-Arbeitsgruppe, Herrn Dr. Christian Probst, Tobias und Luer, danke ich für die gute Zusammenarbeit und gegenseitige Unterstützung"), the first lead author M.J.M. is not mentioned in Mallig (2006) at all.
Prominent fragments[]
- Fragment 040 01: A passage where a review of the literature has been copied
- Fragment 039 12: Figures of histological preparations have been copied
- Fragment 037 01, Fragment 037 05, Fragment 037 10, Fragment 036 55: Charts have been copied, but they show impossible results if the sample sizes stated in the thesis are correct.
Issues with respect to experimental data[]
Publication M.J.M et al. (2008b)[]
In the publication M.J.M et al. (2008b) 15 test mice were used with a mean weight of 23.0 ± 3.1 g. The same mean weight and standard deviation have been recorded for the 34 test mice described in the earlier study Mallig (2006) and yet again the same mean weight and standard deviation were given for the 60 test mice that supposedly were used in the later study M.J.M et al. (2012) (see also next section). Either this is a close to impossible coincidence or two of the mean weights given are not correct and there is a relation between the studies that has not been made transparent to the reader.
Publication M.J.M et al. (2012)[]
As the documentation shows, the results of the paper M.J.M et al. (2012) are taken 1-to-1 from the dissertation Mallig (2006), with the slight modification that the usage of altogether 60 test mice is claimed (three groups of 20 each), of which 9 died (see abstract for mortality rates), such that 51 test mice (three groups: 18, 18, 15) were studied. In Mallig (2006), however, only 34 test mice were used (three groups: 10, 11, 13), of which 5 died and in the end 29 were studied (three groups: 9, 10, 10).
The differences in the number of test animals allows for two possible interpretations: either the stated number of test animals is correct, then the given results must be wrong (because they are identical to the results in Mallig (2006), where fewer test animals are used) or the results are correct, but the number of test animals has been overstated, which would give undue credibility to the study and the claims made in the conclusion section. There it is suggested that the polytrauma model introduced in the paper could be used for preclinical tests of drugs for humans: "This polytrauma model would allow preclinical testing of drugs which are suspected to be protective following neurotrauma complicated by peripheral trauma and shock." Note that this statement cannot be found in the conclusion of Mallig (2006) despite the fact that the rest of the conclusion has been taken from Mallig (2006).
Note that with overstated sample sizes all statistical results (p-values, statistical significance, etc.) that are identical to those given in Mallig (2006) must be wrong as well, as statements about statistical significance are by their nature dependent on sample size.
Note also that the results given in M.J.M et al. (2012) are not even possible given the stated sample sizes, see for instance Fragment 037 01 where precisely 50% of the 15 analysed test mice in the poly group show a certain result.
Publication Probst et al. (2012)[]
In the study Probst et al. (2012) altogether 45 test mice have been used and they were analysed in three (mutually exclusive) groups: the first group of mice was subjected to a traumatic brain injury (WDT-BI group), the second group was subjected to a femoral fracture and hemorrhagic shock (FX-SH group) and the last group was subjected to both procedures (CO-TX group). It is not mentioned explicitly, however, how big each of the three subgroups actually was. As it turns out, there is no way, how the 45 test mice can be split into three groups that would be consistent with the information and results given in the publication, which leads to the conclusion that either the results or the sample sizes are incorrect. Key to the argument are the mortality rates for the three subgroups given in figure 1: 8% (FX-SH), 13% (WDT-BI), 48% (CO-TX): the only way a group of 45 test mice could be split up into three sub-groups such that the given mortality rates are possible is: 12 (FX-SH), 8 (WDT-BI), 25 (CO-TX). Such a split, however, is inconsistent with the statement also made in the publication that 30 test animals underwent a traumatic brain injury (hence belonging either to the WDT-BI or the CO-TX subgroup). Note also:
- A different way of approaching the same issue is to conclude first that 45-30=15 test mice were in the FX-SH subgroup, which would lead to a mortality rate of 6.7% if only one mouse died and of 13.3% if two mice died: In no way a mortality rate of 8% can be achieved in a group of 15 test mice.
- Note that different mortality rates than in figure 1 are given in the abstract: 8% (FX-SH), 13% (WDT-BI), 47% (CO-TX). If those were the correct figures then there would be two possible splits of 45 into subgroups: 12 (FX-SH), 16 (WDT-BI), 17 (CO-TX) and 13 (FX-SH), 15 (WDT-BI), 17 (CO-TX). Both splits are leading to the same inconsistency as described above.
- Regardless of which of the possible sample sizes in the FX-SH group is the correct one, the mortality rate of 8% is only possible if there has been exactly one death in that group and hence the error bar (=standard error) around the mortality rate of 8% given in figure 1 is far too small, and similarly also the other error bars given in figure 1 appear small. If the error bars around the mortality rates are incorrect, one might wonder whether the claims of significant differences throughout the paper are in fact based on sound statistics.
Other observations[]
- The regulation governing the thesis analysed (Habilitationsordnung vom 6. Oktober 2010) demands that the author submits together with the thesis a declaration that all sources used are also given in the thesis:
- "§ 3 Antrag auf Zulassung zu [sic] Habilitation
(1) [...] Dem Antrag sind beizufügen [...]:
4. die schriftliche Habilitationsleistung, die aus einer Habilitationsschrift besteht oder der Zusammenfassung mehrerer wissenschaftlicher Arbeiten, die bereits veröffentlicht sind bzw. zur Veröffentlichung akzeptiert sein müssen;
5. eine Versicherung darüber, dass die Arbeiten nach Nr. 4 von der Bewerberin/vom Bewerber eigenständig und ohne andere als die darin angegebenen Hilfsmittel angefertigt sind; [...]"
- Univ.-Prof. Dr. Dr. Martijn van Griensven was one of the two supervisors of the thesis Mallig (2006). He is also the seventh of the eight authors of M.J.M et al. (2012), so he should have noticed that the paper presents a study of someone else.
- A PubPeer commentary describes problems with the paper M.J.M et al. (2012) that is part of the thesis under review.
Statistic[]
- Currently there are 21 reviewed fragments documented that are considered to be violations of citation rules. For 0 of them there is no reference given to the source used („Verschleierungen“ and „Komplettplagiate“). For 0 fragments the source is given, but the extent of the used text is not made clear („Bauernopfer“).
- The publication has 55 pages that have been analyzed. On a total of 6 of these pages violations of citation rules have been documented. This represents a percentage of 10.9%. The 55 analyzed pages break down with respect to the amount of text parallels encountered as follows:
- From these statistics an extrapolation of the amount of text of the publication under investigation that has been documented as problematic can be estimated (conservatively) as about 7% of the main part of the publication.
- In all, text was taken from 1 sources.
- Note: The scientific core of the thesis is formed by four scientific publications covering 22 pages, of which 6 contain documented text parallels. The ratio 6/22 = 27%.
Illustration[]
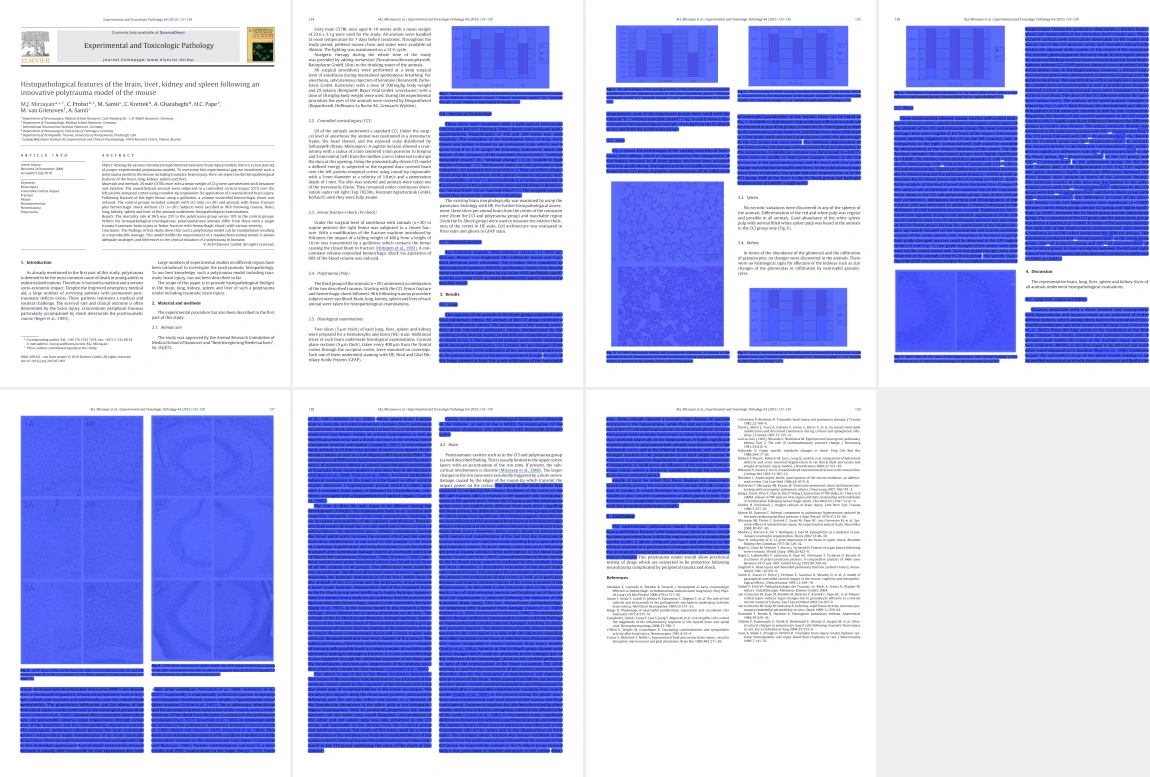
The following chart illustrates the extent and the distribution of the text parallels found. Note that only the paper is shown in which text parallels have been found.
The colours show the type of violation of citation rules diagnosed:
- blau="Übersetzungsplagiat"
(state of analysis: 25-02-2016)